



First Look at the Gann SQ9 Setup
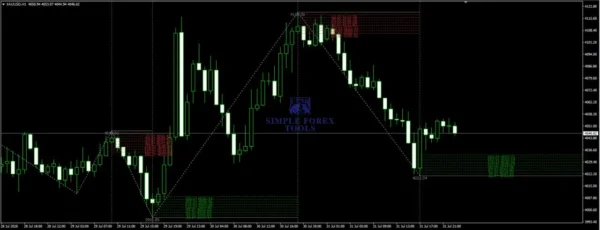
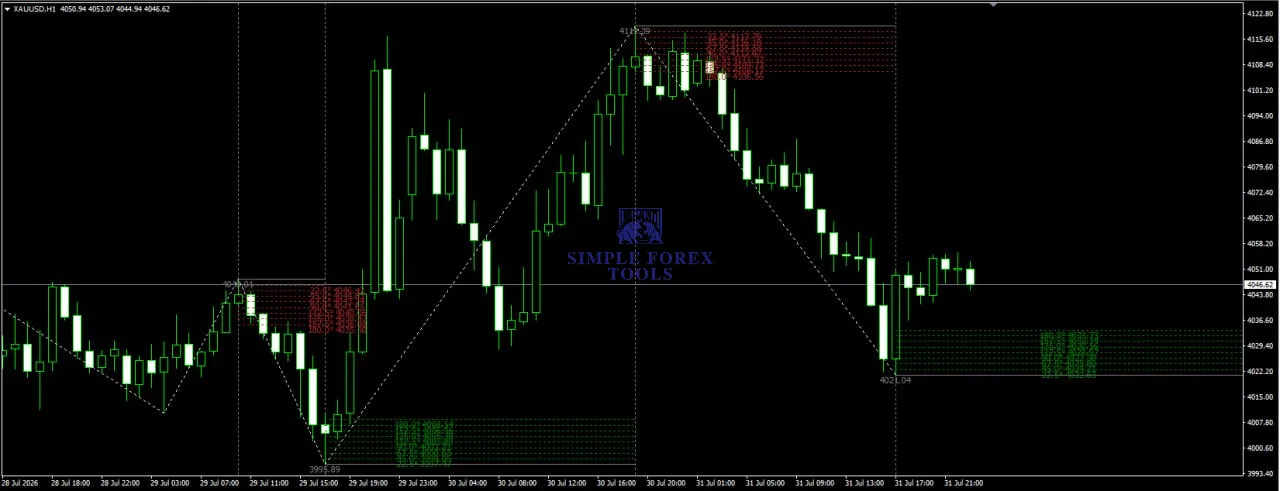
Getting started with the Gann SQ9 MT4 Indicator is refreshingly straightforward. Once attached to a MetaTrader 4 chart, the indicator immediately begins plotting the relevant price levels based on the most recent ZigZag swing points. The visual layout is clean and intuitive, with green lines marking support zones, red lines indicating resistance areas, and white trend lines showing the broader directional bias. A gray horizontal line at level zero marks the starting point of the current trend structure, which helps provide context for the entire projection framework.
What stood out to me early on was how the indicator did not clutter the chart with unnecessary information. Each level felt purposeful and anchored to actual price swings rather than arbitrary mathematical calculations. The levels update dynamically as new ZigZag confirmations occur, ensuring the projections remain relevant to current market conditions. For someone who has spent hours manually drawing support and resistance lines, having this process automated while maintaining the integrity of Gann’s methodology is a significant advantage.
♻️ Telegram Support: Join for updates, announcements, and support
My Experience with Price Level Projections
The core functionality of the Gann SQ9 MT4 indicator revolves around projecting future price levels based on the Square of 9 principles. During my testing, I observed how the indicator calculates extensions and retracements from confirmed swing points, producing levels that often aligned with actual price reactions.
When the ZigZag confirmed a bullish trend reversal, the indicator started plotting ascending support and resistance zones. I found this particularly useful because the levels provided clear reference points for placing stop losses and take profit orders. In one instance on GBPUSD, the indicator projected a key resistance level that price approached over the next several sessions and stalled exactly at that zone before pulling back. That type of precision does not happen every time, but it happened often enough to convince me there is genuine value in the underlying math.
For bearish scenarios, the same logic applies in reverse. When the ZigZag detects a downtrend, the indicator projects descending support and resistance levels that help traders identify potential exit points or reversal zones. The symmetry of the approach makes it adaptable across different market conditions, and I appreciated that the indicator does not attempt to predict direction itself but simply provides the levels that might become relevant.
Where This Indicator Shines
The Gann SQ9 MT4 indicator works best for traders who already have a solid understanding of trend following and want to enhance their entry and exit precision. The automatic level plotting saves considerable time and removes the subjectivity that often comes with manual trendline drawing.
I found the indicator particularly effective on higher timeframes like H1 and H4, where the projected levels tend to hold more weight. The mathematical basis of the Square of 9 seems to resonate better with cleaner market structure, and the ZigZag confirmation helps ensure that false signals are minimized.
The trailing stop-loss application also deserves mention. As price moves in the trend direction, the indicator updates the relevant support and resistance levels, allowing traders to trail their stops at the next lower support level in an uptrend or the next higher resistance level in a downtrend. This approach provides a structured way to lock in profits while still giving trades room to breathe.
Limitations and Considerations
No indicator is perfect, and the Gann SQ9 MT4 is no exception. The projections are ultimately based on mathematical relationships rather than order flow or volume data, which means they work best when combined with additional confirmation tools. I would not recommend relying solely on these levels for entries without considering price action or momentum context.
Additionally, the indicator’s effectiveness tends to vary with market conditions. In strongly trending markets, the projected levels align nicely with price action. In choppy or sideways conditions, the levels may still appear, but price might not react to them with the same consistency. This is not a flaw unique to the Gann SQ9 MT4, but something worth keeping in mind based on my testing experience.
Optimized Settings for Gann SQ9 MT4
| Setting | Recommended Value |
|---|---|
| Platform | MetaTrader 4 |
| Time Frames | H1, H4 (H1 for active trading, H4 for swing setups) |
| Recommended Pairs | Major pairs (GBPUSD, EURUSD, USDJPY, AUDUSD) |
| Minimum Deposit | $100 |
| Recommended Deposit | $500 |
| Leverage | 1:100 to 1:500 (depending on broker) |
| Account Type | Standard or ECN |
| Product Type | Technical Indicator |
| Recommended Broker | Regulated broker with MT4 support and competitive spreads |
How to Install Gann SQ9 on MT4
Step 1: Download the Gann SQ9 indicator file from a trusted source and ensure it has the .ex4 or .mq4 extension.
Step 2: Open your MetaTrader 4 platform and navigate to the top menu. Click on File, then select Open Data Folder.
Step 3: Inside the Data Folder, locate the MQL4 directory and open it. From there, find and open the Indicators folder.
Step 4: Copy the downloaded indicator file into the Indicators folder. Make sure the file is placed directly in this folder, not inside any subfolder.
Step 5: Close and restart MetaTrader 4 completely. After restarting, open the Navigator panel and look under Custom Indicators to find the Gann SQ9 indicator listed.
Step 6: Drag and drop the indicator onto your desired chart. Adjust any settings if needed, or simply use the default configuration to start seeing the levels immediately.
📩 Free Support & Setup Help – Contact us 👉 Telegram Support
My Overall Experience with the Gann SQ9 Indicator
After several weeks of testing the Gann SQ9 MT4 indicator across different pairs and market conditions, I have developed a balanced perspective on its strengths and weaknesses. The automated projection of support and resistance levels based on the Square of 9 math is genuinely useful, especially for traders who prefer objective, structured analysis over subjective charting.
What I appreciate most is how the indicator removes the guesswork from drawing levels. The integration with the ZigZag ensures that only meaningful swing points generate projections, filtering out noise and producing levels that traders can actually use. For someone who values clean charts and clear reference points, this is a welcome addition to the trading toolkit.
The indicator is not a magic bullet, and I would caution against treating it as such. Price action, momentum, and overall market context remain essential for making sound trading decisions. Used as a complement to these factors, however, the Gann SQ9 provides a unique angle that can enhance both entry timing and risk management.
If you are looking for a fresh way to identify potential reversal zones and trend continuation levels, this indicator is worth exploring. The free availability and easy installation remove any barriers to trying it out, and the insights it offers may surprise you once you spend some time with it on live charts.
We also have a growing collection of Myfxbook products for traders who want to check performance-based tools, low drawdown EAs for more controlled risk management, and powerful forex indicators to help improve market analysis and trade timing.
👉 Reviewed By – William S

Neuro Poseidon MT4
After spending several weeks testing Neuro Poseidon MT4 across different pairs and timeframes, I can say this indicator delivers exactly what it promises. The non-repainting signals are refreshingly reliable, and the adaptive Take Profit and Stop Loss levels remove the guesswork from trade management. I found the signals clean and easy to follow, with clear entry points that stayed fixed once printed. This is not another arrow indicator that repaints or leaves you second-guessing. It is a complete signal system that gives you a full trade plan every time.
BS-Market Displayer MT4
Most traders lose money because they rely on single-timeframe signals without confirmation. BS-Market Displayer MT4 Indicator solves this by combining multi-timeframe trend logic with Renko-based filtering. It gives structured entries instead of emotional trades.
PipFinite Trend Laser MT4
Most traders lose because they enter against the real trend or react to noise. I tested PipFinite Trend Laser MT4 to fix exactly that problem-clean trend direction + structured entries. It’s not magic, but it removes hesitation and gives you a system you can actually follow.


Reviews
There are no reviews yet.